Sessions on the chart
Runner Lesson 10 taught you the clock: Globex runs from Sunday 5:00 p.m. CT to Friday 4:00 p.m. CT with a daily break from 4:00 p.m. to 5:00 p.m. CT, and RTH is 8:30 a.m. to 3:00 p.m. CT, when the New York Stock Exchange’s core session (9:30 a.m. to 4:00 p.m. ET) is open. This lesson does not re-teach those times. It shows you what those sessions look like on a chart, so you can tell at a glance which part of the day you are looking at.
Two sessions, one chart
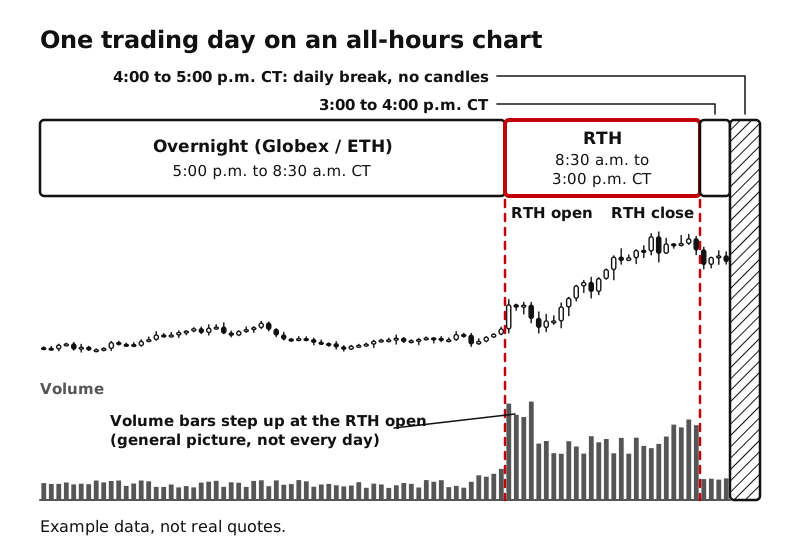
On an intraday ES, NQ, MES, or MNQ chart, each trading day contains two kinds of stretch:
- Overnight (also called Globex or ETH, extended trading hours): from the 5:00 p.m. CT reopen until 8:30 a.m. CT.
- RTH: 8:30 a.m. to 3:00 p.m. CT, when the stock market’s cash session and the futures trade at the same time.
Then there is the short stretch from 3:00 p.m. to 4:00 p.m. CT after the stock market closes, and the one-hour break with no trading at all.
What volume looks like across the day
The clearest visual difference between the sessions is usually in the volume bars (Lesson 8).
A CME Group article from 2020 looked at Micro E-mini volume by hour of day from May 2019 through August 2020. It found that most trading took place during regular trading hours, while the extended hours still carried a real share: about 25% of total daily volume for MES and about 30% for MNQ. Remember that those figures are for that period, and that ETH covers many more hours than RTH, so its share is spread thinly across a long night.
CME’s volume lesson adds that volume tends to be higher around the open and close of the trading day. Put those together and you can expect, as a general picture, volume bars that are shorter through much of the night and step up around the RTH open at 8:30 a.m. CT. Do not take that on trust: pull up a chart with volume and look at a few days yourself. Lesson 11 shows you how.
All-hours chart vs. RTH-only chart
A chart can be built from all Globex hours or from RTH only, and the two look very different:
- All-hours chart: every candle from the 5:00 p.m. CT reopen onward is drawn. You see the overnight session flowing into RTH, and the overnight high and low are on screen.
- RTH-only chart: only 8:30 a.m. to 3:00 p.m. CT is drawn. The candle at 3:00 p.m. CT sits right next to the next day’s 8:30 a.m. CT candle, as if the night never happened. Anything price did overnight is hidden.
Neither is wrong. They answer different questions. An RTH-only chart lines up with the hours the stock market is open; an all-hours chart shows everything the futures actually did. What matters is that you know which one you are looking at, because the same day can show a very different high, low, and starting point on each. Lesson 10 shows what that does to the chart at the open.
Spotting the session on any chart
Quick checks:
- Read the time axis. Find 8:30 a.m. CT. That is the RTH open. (If your chart shows another time zone, convert first.)
- Look for the daily break. On an all-hours intraday chart, the 4:00 p.m. to 5:00 p.m. CT pause has no candles, which marks where one trading day ends and the next begins.
- Look at the volume bars. Compare the height of the bars before and after 8:30 a.m. CT.
Key ideas
- An index futures chart contains overnight (Globex / ETH) and RTH (8:30 a.m. to 3:00 p.m. CT) stretches; Runner Lesson 10 owns the exact clock.
- A 2020 CME Group article found most MES and MNQ volume traded during RTH, with about 25% (MES) and 30% (MNQ) in the extended hours.
- As a general picture, volume bars are taller during RTH than through most of the night; check it on real charts yourself.
- An all-hours chart shows the overnight session; an RTH-only chart skips it.
- The daily break (4:00 p.m. to 5:00 p.m. CT) leaves a stretch with no candles.