Volume
A candle tells you where price went. It does not tell you how much trading it took to get there. For that, traders look at volume, usually drawn as a row of bars under the price chart. This lesson covers what volume counts and how to read those bars.
What volume counts
CME Group’s lesson on volume explains it simply: volume counts the number of contracts traded over a given time. It is reported for every futures contract, and you can view it for any period, from a single candle to a whole day.
Every trade has a buyer and a seller on opposite sides of the same contract. That contract counts once. CME’s example: a trader who is short one E-mini S&P 500 contract buys one contract to close it, and volume rises by 1.
So if a 5-minute candle shows volume of 2,500, that means 2,500 contracts changed hands during those five minutes. (Example number, not real data.)
Reading volume bars
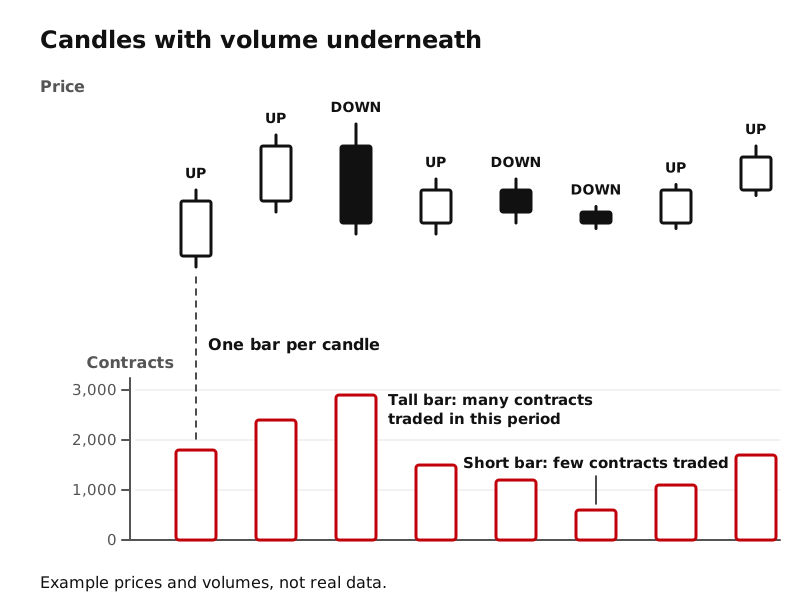
Volume bars are drawn in their own panel directly under the price candles:
- There is one volume bar per candle, lined up underneath it.
- The bar’s height is the number of contracts traded in that candle’s period.
- A tall bar means a lot of trading in that period; a short bar means little.
Read volume by height only. If your platform colors each volume bar to match its candle, that color is a display setting and adds no new information: the candle above already tells you whether price closed up or down.
Volume and the clock
Volume is not spread evenly through the day. CME’s volume lesson says markets often see higher volume around the open and close of the trading day, and gives the midday hours of 12:00 p.m. to 2:00 p.m. ET (11:00 a.m. to 1:00 p.m. CT) as an example of a time when volume can be lower. CME also notes that traders tend to prefer busier times, because more people are actively buying and selling.
On a chart, this shows up as a pattern in the bar heights over a day. Lesson 9 looks at how that plays out across the overnight session and RTH.
CME also suggests comparing current volume with the average over a longer stretch, such as a few weeks or months, to see whether today is busier or quieter than usual. “Tall” and “short” are always relative.
Volume and the roll
Volume also helps you see which contract month is active. In Runner Lesson 9 you learned about rolling from an expiring contract to the next one. CME’s lesson explains that during the roll, volume drains out of the expiring month and builds in the next one. When the new month has more volume, it has become the active contract. That is one reason to check your chart is showing the right month.
What volume cannot tell you
This is the most important part. CME is clear that volume cannot show:
- whether traders were buying or selling (every contract has both a buyer and a seller), or
- whether they were opening or closing positions.
A tall volume bar on a down candle does not prove sellers “won”, and a tall bar does not mean price will bounce or keep going. Volume tells you how much traded, not why or what next. It is context, not a signal.
Key ideas
- Volume counts the contracts traded in a period. One contract changing hands adds 1.
- Volume bars sit under the price chart, one per candle; read them by height, not color.
- Volume tends to be higher around the open and close and can be lower around midday (11:00 a.m. to 1:00 p.m. CT in CME’s example).
- During the roll, volume moves from the expiring month to the next month.
- Volume cannot show who was buying or selling, or what price will do next.