Gaps
Most of the time, each candle on a chart starts close to where the previous one ended. Every so often, though, the chart jumps: one candle ends, and the next one begins well above or below it, with empty space in between. That empty space is called a gap. This lesson explains what a gap is and why the chart jumps between sessions.
What a gap is
A gap is a price range where no trading happened between two neighboring candles. CME Group’s candlestick lesson describes candles that gap above or below the previous candle and shows a daily Treasury futures chart that gapped down.
Two kinds, named by direction:
- Gap up: the new candle’s low is above the previous candle’s high. There is an empty space below the new candle.
- Gap down: the new candle’s high is below the previous candle’s low. There is an empty space above the new candle.
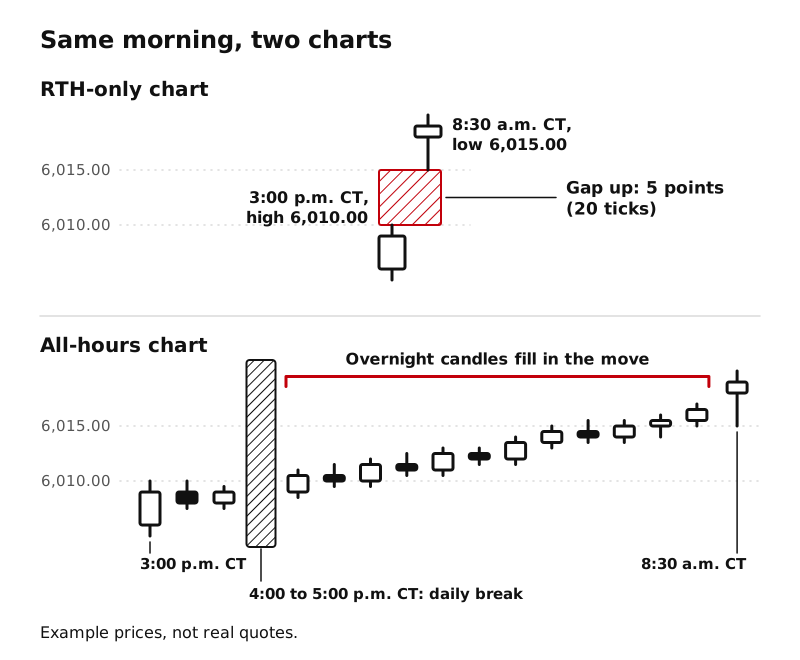
Example prices, not real quotes: yesterday’s last candle had a high of 6,010.00. Today’s first candle opens at 6,018.00 and its low is 6,015.00. The space from 6,010.00 to 6,015.00 is a gap up of 5 points, which is 20 ticks (5 times 4, from Runner Lesson 6).
Why prices jump
A chart only draws trades. If no trades happen for a while, but the price people are willing to pay changes during that time, the next trade can be at a very different price. On the chart, that shows up as a jump.
For index futures, there are two main reasons the chart skips time.
1. The market was closed
From Runner Lesson 10 and CME’s contract specs: ES, NQ, MES, and MNQ stop trading every weekday from 4:00 p.m. to 5:00 p.m. CT, and for the weekend from Friday 4:00 p.m. CT to Sunday 5:00 p.m. CT. News and events do not stop while the market is closed. When it reopens, the first trades happen at whatever price buyers and sellers now agree on, which may be far from the last price before the close.
On an all-hours chart, these closures are the main places you see big session gaps, because they are the only times the market is not trading at all. The Sunday reopen after a full weekend is the classic example.
2. The chart is hiding hours
In Lesson 9 you met the RTH-only chart, which draws only 8:30 a.m. to 3:00 p.m. CT. The futures keep trading through the night, but the chart does not draw those candles. So the 8:30 a.m. CT candle sits right next to the previous day’s 3:00 p.m. CT candle, and if price moved overnight, the chart shows a jump between them.
This is why the same morning can show a gap on an RTH-only chart and no gap on an all-hours chart. On the all-hours chart, you can see the overnight candles walking price from one level to the other. On the RTH-only chart, that walk is hidden.
Small gaps inside a session
Gaps can also appear between candles during trading, especially on very short timeframes or when the market is thin. CME’s volume lesson notes that when volume is high, fewer gaps tend to exist between ticks, which also means quieter moments can leave more empty space.
Not a signal
Some traders treat gaps as important clues, and CME’s lesson mentions them as something chart readers watch. In LearnToTick, a gap is vocabulary: it describes where price reopened compared with where it was. It does not tell you what price will do next, and it is not a reason to buy or sell by itself.
Key ideas
- A gap is empty price space between two neighboring candles where no trading happened.
- Gap up: new low above the previous high. Gap down: new high below the previous low.
- Index futures gap mostly where the market was closed (the daily 4:00 to 5:00 p.m. CT break and the weekend).
- An RTH-only chart can show a gap at 8:30 a.m. CT because it hides the overnight session.
- A gap describes the past. It is not a signal.