Timeframes
Every candle covers a slice of time. How big that slice is, is called the chart’s timeframe. Change the timeframe and the same trades are drawn as more, smaller candles or fewer, bigger ones. It is like zooming a map in and out: the streets do not change, only how much detail you see.
What timeframe means
On a 1-minute chart, each candle shows one minute of trading: its open, high, low, and close. On a 5-minute chart, each candle shows five minutes. On a daily chart, each candle shows one whole trading day.
CME Group’s technical analysis course notes that a time-based chart can make a new candle anywhere from every minute to every week or longer, and that traders pick timeframes to match how long they plan to hold a trade: a longer-term trader may watch weekly or monthly charts, a shorter-term trader 60-minute or 5-minute charts.
Counting candles in RTH
You learned in Runner Lesson 10 that RTH runs 8:30 a.m. to 3:00 p.m. CT. That is 6.5 hours, or 390 minutes. So during RTH:
| Timeframe | Math | Candles in RTH |
|---|---|---|
| 1-minute | 390 divided by 1 | 390 |
| 5-minute | 390 divided by 5 | 78 |
| 15-minute | 390 divided by 15 | 26 |
| Daily | the whole trading day | 1 (covering more than just RTH) |
The smaller the timeframe, the more candles, and the more detail.
How small candles build a big one
A bigger candle is just the smaller candles added together. To build one 15-minute candle from fifteen 1-minute candles:
- Open = the open of the first 1-minute candle.
- Close = the close of the last 1-minute candle.
- High = the highest high of all fifteen.
- Low = the lowest low of all fifteen.
The details in between disappear. They are still in the 1-minute candles; the 15-minute candle just summarizes them.
One move, four views
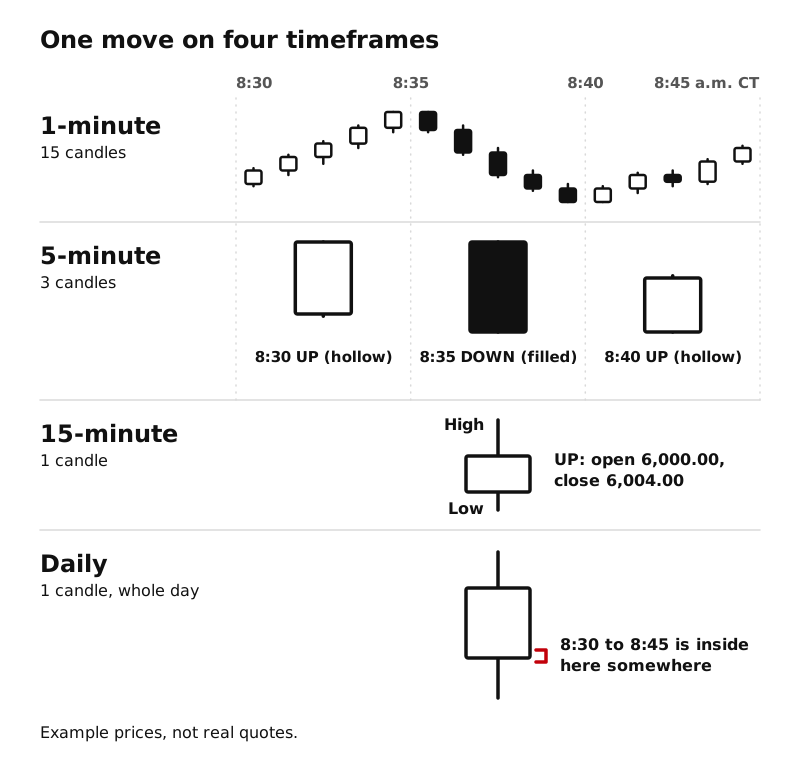
Example prices, not real quotes. Suppose MES does this between 8:30 and 8:45 a.m. CT:
- 8:30 to 8:35: rises from 6,000.00 to 6,008.00.
- 8:35 to 8:40: falls back to 5,998.00.
- 8:40 to 8:45: rises again and finishes at 6,004.00.
Here is how that same quarter hour looks on each timeframe:
- 1-minute chart: fifteen small candles. You see every push and pullback, minute by minute.
- 5-minute chart: three candles: one up candle (hollow), one down candle (filled), one up candle (hollow).
- 15-minute chart: one candle. Open 6,000.00, close 6,004.00, so it is a small up candle, with a high of at least 6,008.00 and a low of 5,998.00 or lower. The big swing down in the middle shows up only as wicks.
- Daily chart: this quarter hour is a tiny part of one candle that covers the whole trading day. You cannot see it at all.
Same trades. Four very different pictures.
A note on daily candles in futures
In Runner Lesson 10 you learned the futures trading day starts the evening before (Globex opens at 5:00 p.m. CT and the day ends at 4:00 p.m. CT, per CME’s contract specs). A daily futures candle can therefore cover overnight trading as well as RTH. Before you read a daily candle, check your platform’s settings to see which hours it includes.
No timeframe is “right”
A 1-minute chart is not more accurate than a daily chart, and a daily chart is not more important than a 1-minute chart. They show the same market at different zoom levels. Later levels will show how traders use more than one at a time. For now, the skill is simple: always know which timeframe you are looking at before you read a single candle.
Key ideas
- A chart’s timeframe is how much time each candle covers.
- RTH is 390 minutes: 390 one-minute, 78 five-minute, or 26 fifteen-minute candles.
- A bigger candle’s open is the first open, close is the last close, high is the highest high, low is the lowest low.
- The same move looks completely different on different timeframes.
- Always check which timeframe you are reading. None is “right” on its own.