Moving averages
A moving average is one of the oldest and simplest lines you can put on a chart. CME Group’s technical analysis course notes it is often one of the first indicators traders add. This lesson covers what it is, the two common types, and how it differs from VWAP.
What “moving” means
CME’s course defines a moving average as the average price of a contract over a set period of time. For example, a 14-day moving average is the average closing price of the last 14 days.
The “moving” part is the key. Each time a new bar closes, the oldest bar drops out of the window and the newest one comes in. The average is recalculated, and the result is drawn as a line that travels along with price.
The number in the name is the length: how many bars are in the window. A 20-period moving average on a 5-minute chart averages the last 20 five-minute closes. The same “20” on a daily chart averages the last 20 days.
Simple moving average (SMA)
The simple moving average adds up the closing prices in the window and divides by how many there are. Every bar counts equally.
A worked example
These prices are made up for practice, not real quotes.
A 3-period SMA with closes of 20,000.00, 20,010.00, and 20,020.00:
(20,000 + 20,010 + 20,020) / 3 = 20,010.00
Next bar closes at 20,030.00. The oldest close (20,000.00) drops out:
(20,010 + 20,020 + 20,030) / 3 = 20,020.00
That is the whole idea. The window slides forward one bar at a time.
Exponential moving average (EMA)
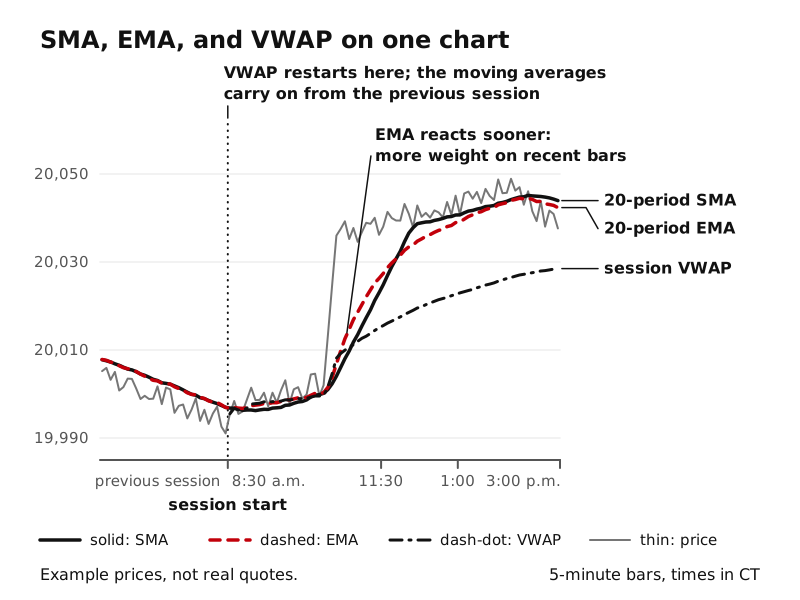
The exponential moving average gives more weight to recent prices and less to older ones. CME’s course explains this makes the EMA more responsive to price changes than an SMA of the same length.
CME shows the recipe using a multiplier of 2 divided by (1 + the length). For a 14-period EMA that is 2 / 15 = about 0.133. Each new EMA value is (today’s price times the multiplier) plus (yesterday’s EMA times 1 minus the multiplier). You never need to do this by hand; as CME notes, the indicator calculates it for you. What matters is the idea: EMA leans toward recent bars, SMA treats all bars in the window alike.
What traders do with them
CME’s course describes two common uses, which we present here as vocabulary only:
- Possible support and resistance. A moving average below price is often described as possible support, and one above price as possible resistance (Lesson 3). CME notes that traders commonly use lengths such as 9, 21, 50, 100, and 200.
- Crossovers. When a shorter moving average crosses a longer one, traders call it a crossover. CME describes how some traders read these.
Both of these are interpretations. A moving average is a smoothed record of past prices, so it always lags. Price can cross a moving average many times in a choppy market (Lesson 1) without anything meaningful happening. None of this is a signal by itself.
How moving averages differ from VWAP
At first glance a moving average and VWAP look alike: both are lines that follow price, and TradingView’s VWAP help page itself compares VWAP to a moving average. But they are built differently.
| Moving average | VWAP | |
|---|---|---|
| What goes in | A fixed number of recent bars (the length) | Every bar since the anchor |
| Volume | Ignored in the standard SMA and EMA | Each price weighted by its volume |
| Resets? | No, the window just slides along | Yes, at each anchor (usually the session start) |
| Main question it answers | “What has the average price been over the last N bars?” | “What price did the volume trade at, on average, since the anchor?” |
A practical consequence: at the start of a session, VWAP starts over from the first bar, while a moving average still carries prices from the previous session in its window.
Key ideas
- A moving average is the average price over a fixed window of recent bars, recalculated each new bar.
- SMA weights every bar in the window equally; EMA gives more weight to recent bars and reacts faster.
- Moving averages ignore volume and slide continuously; VWAP weights by volume and resets at its anchor.
- Traders describe moving averages as possible support and resistance and talk about crossovers, but moving averages lag and are never a signal by themselves.