Anchored VWAP
In Lesson 6 you learned that VWAP keeps running totals since a starting point, and that the starting point is called the anchor. The everyday VWAP is anchored to the start of each session. But nothing in the math forces that. You can start the running totals from any bar you like. That is an anchored VWAP. TradingView’s Anchored VWAP drawing tool works exactly this way: you click the point on the chart where the calculation should start.
Same formula, different starting bar
The calculation does not change at all:
VWAP = running total of (price times volume) / running total of volume, counted from the anchor.
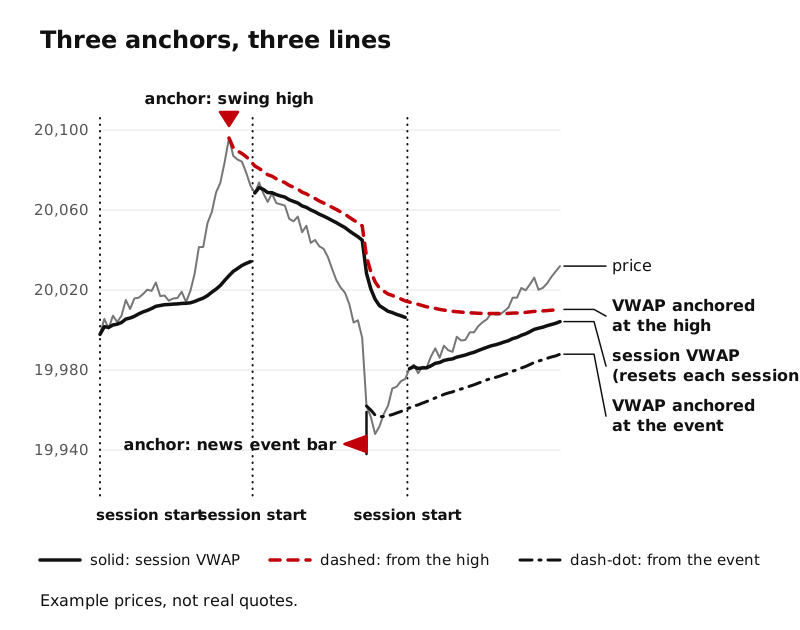
The only difference is where the counting begins. With a session VWAP, the totals reset at every session start. With an anchored VWAP, the totals start at the bar you pick and keep running from there, across as many sessions as you like, until you move the anchor.
TradingView’s help pages show how flexible this is. Its regular VWAP indicator has an anchor period setting (session, week, month, quarter, year, and longer). Its auto anchored VWAP can also start from the highest high or lowest low of a chosen number of recent bars, or from the bar with the highest volume.
What an anchored VWAP tells you
Here is the plain-language meaning, and it is worth memorizing:
An anchored VWAP is the average price, weighted by volume, that everyone who traded since the anchor has paid.
That is why the choice of anchor matters. Each anchor answers a different question.
Three common kinds of anchor
1. A session or period start
Anchoring at the start of the session gives you the normal VWAP from Lessons 6 and 7. Anchoring at the start of the week or month gives the average traded price over that longer stretch. These are useful for seeing whether today’s price is above or below where the market has traded, on average, all week.
2. A notable high or low
Anchor at a big swing high (Lesson 2) and the line shows the average price paid by everyone who traded since the market topped. Anchor at a swing low and it shows the average since the bottom. This turns a single price point into a line that keeps updating as new volume trades.
3. An event
Anchor at the bar of a major event, such as the bar when an important economic report came out (Lesson 13). The line then shows the average price traded since the news hit. Stock traders do the same with earnings reports; TradingView even offers earnings, dividends, and splits as built-in anchors for stocks. Futures contracts do not report earnings, so for a futures event you pick the event bar yourself.
A worked example
Prices and volumes are made up for practice, not real quotes.
Suppose a swing low printed at 19,900.00 and you anchor there. Over the next three bars, using one price per bar:
- Bar 1 (anchor): 19,900.00, volume 200, price x volume 3,980,000
- Bar 2: 19,920.00, volume 100, price x volume 1,992,000
- Bar 3: 19,940.00, volume 100, price x volume 1,994,000
Totals: 7,966,000 divided by 400 = 19,915.00. The anchored VWAP sits at 19,915.00, much closer to the heavy-volume anchor bar than to the latest price of 19,940.00.
Cautions
- Lag still applies. TradingView notes that VWAP lags because it averages past data. An anchored VWAP that has been running for a long time moves very slowly.
- You choose the anchor, so you can fool yourself. It is easy to keep moving the anchor until the line “looks right.” Decide your anchor for a clear reason (session start, a swing point, an event) before you look at the result.
- It is not a signal. An anchored VWAP is a reference line, just like support and resistance in Lesson 3. Price can sit above it, below it, or cut straight through it.
Key ideas
- An anchored VWAP uses the same VWAP formula but starts the running totals from a bar you choose.
- Common anchors: a session, week, or month start; a swing high or low; an event bar.
- It shows the volume-weighted average price paid by everyone who traded since the anchor.
- Choose the anchor for a clear reason before looking; it lags, and it is not a signal.