Support and resistance
Support and resistance are probably the two words you will hear most often in trading. They sound technical, but the idea is simple: some prices seem to matter more than others, and the market often reacts when it gets back to them.
The definitions
CME Group’s technical analysis course describes them like this (in our words):
- Support is a level where a falling market might slow down, stop, or turn back up. Support sits below the current price.
- Resistance is a level where a rising market might slow down, stop, or turn back down. Resistance sits above the current price.
Notice that whether a level is “support” or “resistance” depends only on where price is right now. The same price can be resistance today (price is below it) and support tomorrow (price is above it).
Why levels form
CME’s course explains that technical analysts believe price has a kind of memory. When a market turns at a certain price, traders notice. If enough people cared about that price the first time, many of them tend to behave in a similar way when price comes back.
CME lists the main places traders look for these levels:
- Previous highs and lows. Markets often pause near earlier highs and lows. A market rising toward an old high may meet selling there; a market falling toward an old low may meet buying there. These are the swing highs and lows from Lesson 2.
- Key price levels. Some prices attract attention just because they are notable, often round numbers. CME’s example is a crude oil chart where one round-number price capped the market for years.
- Moving averages. A moving average line below price can be treated as support, and one above price as resistance. You will meet these in Lesson 9.
- Trend lines. Lines drawn through a series of rising lows (or falling highs) can act like sloping support or resistance.
Why levels break
Levels are not walls. They break all the time. A level holds only as long as the traders defending it outnumber the traders pushing through it. When that balance changes, price moves through.
CME’s course points out something useful about broken levels: they often switch roles.
- When price breaks down through support, that old support often acts as resistance if price comes back up to it.
- When price breaks up through resistance, that old resistance often acts as support if price comes back down to it.
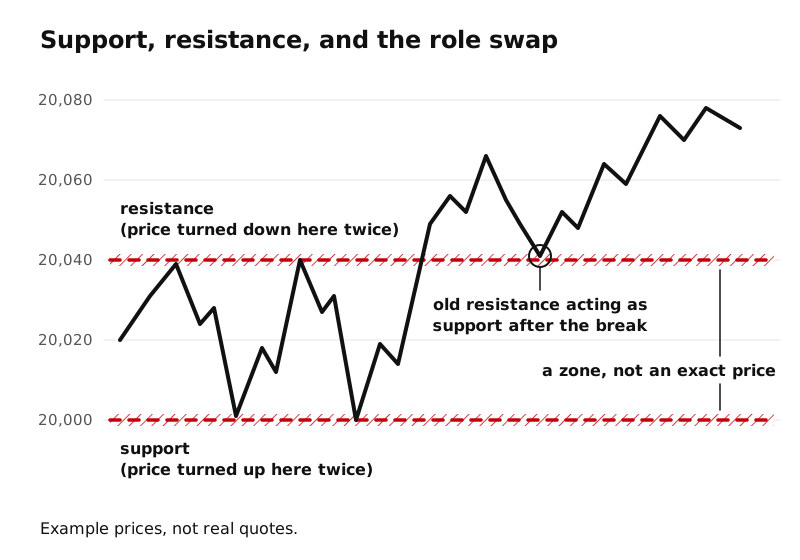
Zones, not exact prices
One more point from CME’s course that saves beginners a lot of frustration: support and resistance do not hold “to the penny.” They are zones. Price might stop a few ticks short of an old high, or poke a few ticks past it before turning. If you draw a level as a single thin line and expect price to respect it exactly, you will be disappointed most of the time. Think of it as a band of prices.
What support and resistance are not
Support and resistance are a way to map the chart: they show you where the market has reacted before and might react again. They are not a guarantee and not a signal by themselves. A level can hold three times and break on the fourth. CME describes them as one more piece of information to include when you assess the market, alongside everything else you know.
As you go through this level, you will see that almost every tool (key reference levels, VWAP, moving averages, volume profile) ends up being discussed in terms of support and resistance. This lesson is the foundation for all of them.
Key ideas
- Support is below price, where a fall might stop; resistance is above price, where a rise might stop.
- Levels form because traders remember earlier highs, lows, round numbers, and other notable prices.
- Common sources of levels: previous highs and lows, key price levels, moving averages, and trend lines.
- Broken support often becomes resistance, and broken resistance often becomes support.
- Levels are zones, not exact prices, and they are never a signal by themselves.