Volatility and time of day
Spend a week watching ES or NQ and you will notice that the market does not have one personality. Some parts of the day feel fast and jumpy; others feel slow. This lesson explains the scheduled events that shape the trading day and shows you how to measure the rest yourself, instead of taking anyone’s word for it.
What volatility means
Volatility is how much, and how quickly, price moves.
- High volatility: big bars, fast swings, price covering many points in a short time.
- Low volatility: small bars, slow movement, price covering few points.
From Runner Lesson 6, every point on MNQ is worth $2 per contract and on MES $5 per contract. So a 20-point bar on MNQ is a $40 swing per contract, while a 5-point bar is $10. The same position feels very different in a fast market than in a slow one.
The scheduled events in a trading day (all times CT)
Some moments in the day are fixed by the calendar. These are facts you can check.
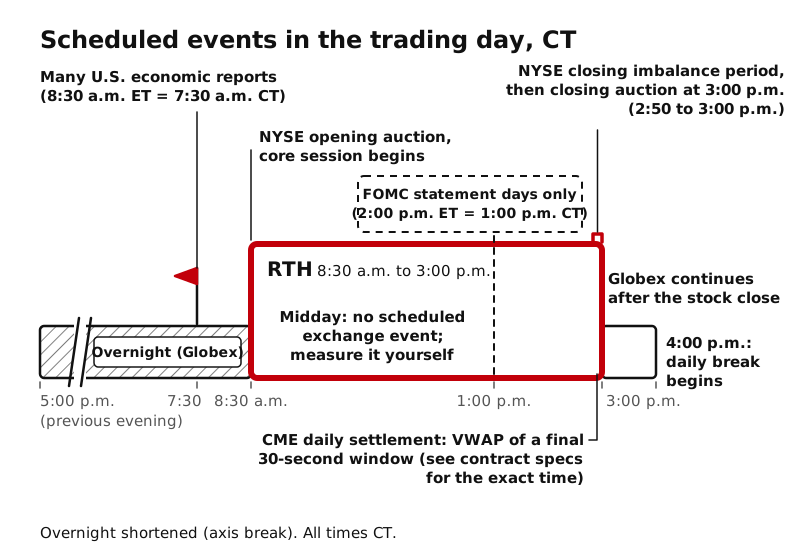
Before RTH: 7:30 a.m. CT data releases
Many major U.S. economic reports come out at 8:30 a.m. ET, which is 7:30 a.m. CT. For example, the Bureau of Labor Statistics schedule lists the Consumer Price Index at 8:30 a.m., and the CPI release itself states it is embargoed until 8:30 a.m. (ET). That is an hour before RTH opens, while the futures are trading on Globex.
CME Group’s own economic research found that equity index futures trading volume rises in the minutes after 8:30 a.m. ET releases when the numbers surprise forecasts, with inflation and employment data among the reports that mattered most. Lesson 13 covers these reports.
8:30 a.m. CT: the RTH open
At 9:30 a.m. ET (8:30 a.m. CT) the NYSE holds its opening auction and its core trading session begins (Lesson 5). From this moment, the stocks inside the S&P 500 and Nasdaq-100 trade in their main session alongside the futures.
Midday
There is no scheduled exchange event in the middle of the RTH session. How midday behaves is something you should measure on your own charts rather than accept as a rule (see the exercise below).
Some afternoons: 1:00 p.m. CT Fed statements
On the eight scheduled FOMC meeting days a year, the Federal Reserve releases a policy statement. The September 16, 2026 statement, for example, was marked “for release at 2:00 p.m. EDT,” which is 1:00 p.m. CT. Always check the time on the Fed’s own calendar for each meeting. Lesson 13 covers this too.
Into the close: 2:50 p.m. to 3:00 p.m. CT
The NYSE lists a closing imbalance period from 3:50 to 4:00 p.m. ET (2:50 to 3:00 p.m. CT), followed by its closing auction at 4:00 p.m. ET (3:00 p.m. CT). On the futures side, CME Group explains that the daily settlement price for most equity index futures is a VWAP of trades in the final 30 seconds of the trading day (Runner Lesson 12, and Lesson 6 of this level). The exact settlement window for each contract is listed in its settlement procedures on CME’s contract specs page. So several official closing procedures cluster around the end of RTH.
Measure the rest yourself
Here is an exercise that teaches you more than any statistic someone hands you:
- Open a 5-minute chart of MES or MNQ in a simulator or charting platform.
- For one session, write down the range (high minus low, in points) of the first 30 minutes of RTH, a 30-minute stretch around midday, and the last 30 minutes before 3:00 p.m. CT.
- Note the volume bars in the same three windows (Clerk Lesson 8).
- Repeat for at least 10 sessions, then compare.
Another way to see activity change: CME’s chart lesson notes that a tick chart (a new bar every set number of trades) forms bars faster when volume is high and slower when it is low. Watching how fast new tick bars appear through the day is a direct view of how busy the market is.
Whatever you find, write it down with the dates. Your notes are evidence about your market in your period. They are not a rule for tomorrow: unscheduled news can make any part of the day volatile.
Key ideas
- Volatility is how much and how fast price moves; it changes the dollar size of every move you are exposed to.
- Scheduled moments (CT): many U.S. data releases at 7:30 a.m., the RTH open at 8:30 a.m., FOMC statements at 1:00 p.m. on meeting days, and the NYSE closing period from 2:50 to 3:00 p.m., with CME’s daily settlement taken from a VWAP of a final 30-second window.
- Midday has no scheduled exchange event; measure its behavior on your own charts.
- Time-of-day knowledge is context, not a signal.