What VWAP is
VWAP (say “vee-wap”) stands for volume-weighted average price. It is a line many traders put on intraday futures charts. Before you can read it, you need to know exactly what it is, because once you understand the math, a lot of the mystery disappears.
An average where volume gets a vote
A plain average treats every price the same. VWAP does not. It gives more weight to prices where more contracts traded. If 300 contracts traded at one price and only 100 traded at another, the first price counts three times as much.
So VWAP answers a specific question: “On average, what price did the volume trade at since the start?”
The formula
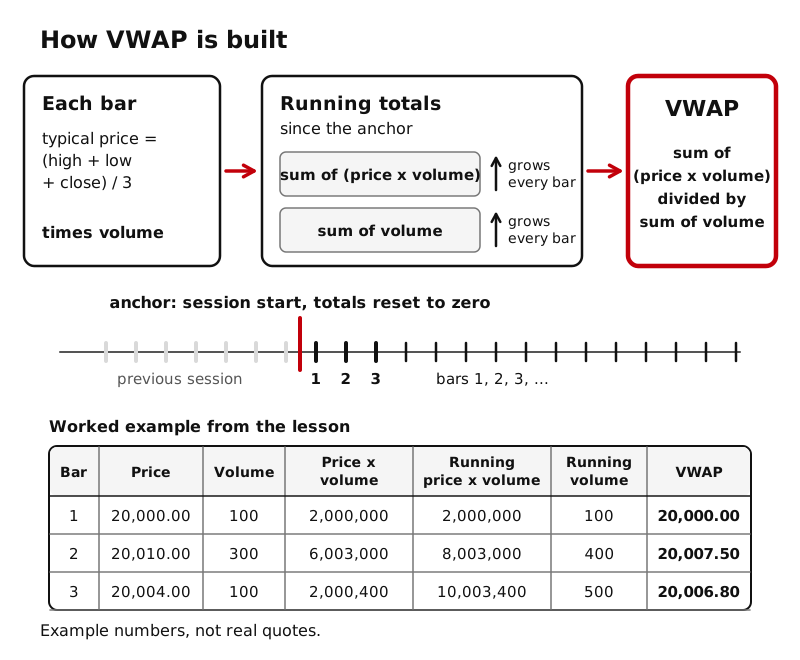
Charles Schwab’s education article describes VWAP as the cumulative total of each trade’s price times its volume, divided by the total volume traded. TradingView’s help page for its built-in VWAP lays out the same idea in steps for chart bars:
- For each bar, find a typical price. TradingView’s default is (high + low + close) divided by 3.
- Multiply that typical price by the bar’s volume.
- Keep a running total of price times volume.
- Keep a running total of volume.
- Divide: VWAP = running total of (price times volume) / running total of volume.
The word “running” (or cumulative) is the key. VWAP does not look back over a fixed number of bars. It uses every bar since the starting point, and the starting point is called the anchor. On an intraday chart the usual anchor is the start of the session, so VWAP resets and begins again each session. Schwab notes that each new day’s calculation starts fresh, unrelated to the previous day. TradingView lets you choose other anchors (week, month, and more), which leads to Lesson 8.
A worked example
These numbers are made up for practice. They are not real quotes or real volumes.
Three bars, using one price per bar to keep it simple:
| Bar | Price | Volume | Price x volume | Running price x volume | Running volume | VWAP |
|---|---|---|---|---|---|---|
| 1 | 20,000.00 | 100 | 2,000,000 | 2,000,000 | 100 | 20,000.00 |
| 2 | 20,010.00 | 300 | 6,003,000 | 8,003,000 | 400 | 20,007.50 |
| 3 | 20,004.00 | 100 | 2,000,400 | 10,003,400 | 500 | 20,006.80 |
Check the last row: 10,003,400 divided by 500 = 20,006.80.
Now compare with a plain average of the three prices: (20,000 + 20,010 + 20,004) / 3 = 20,004.67 (rounded). VWAP is higher, at 20,006.80, because bar 2 had three times the volume of the others, so its price pulled the average toward it.
Notice also that VWAP is a calculated number. It does not have to land on a 0.25 tick like a real trade price does.
Why institutions use it
Schwab’s article describes VWAP as a benchmark as well as a chart line. A benchmark is a yardstick, here for judging how well a large order was filled.
Imagine a fund that must buy thousands of contracts over a day. It cannot buy them all at once without pushing the price. So it spreads the order out. At the end of the day, someone asks: “Did we get a good price?” Comparing the fund’s average fill price with the day’s VWAP gives a fair answer, because VWAP is what the whole market paid on average, weighted by volume. Schwab’s article notes that institutional traders may track VWAP for exactly this kind of large-order comparison.
The exchange itself uses the idea, too. CME Group’s education course on equity index settlement explains that for most equity index futures, the daily settlement price (Runner Lesson 12) for the front month is a VWAP of trades in the final 30 seconds of the trading day. So VWAP is not just a chart indicator. It is built into how the market keeps score.
What VWAP is not
VWAP is an average of the past. Like any average, it lags: TradingView’s help page points out that the closer it gets to the day’s close, the more lag the indicator has. (Each new bar is a smaller and smaller share of a growing total.) Late in the day, VWAP moves slowly even when price moves fast.
And it is not a signal. It tells you the volume-weighted average price so far. What traders read into it is the subject of the next lesson.
Key ideas
- VWAP = running total of (price times volume) divided by running total of volume, since the anchor.
- Prices with more volume pull VWAP toward them more than prices with little volume.
- The usual intraday anchor is the session start, so VWAP resets each session.
- Institutions use VWAP as a benchmark for fill quality, and CME uses a VWAP to set daily settlement for most equity index futures.
- VWAP lags and is not a signal by itself.