Reading candle size
You can now name every part of a candle and tell an up candle from a down one. The next skill is reading size: how big the body is, how long the wicks are, and how they compare. CME Group’s technical analysis course points to exactly these two things, the size of the body and the size of the wick compared with the body, as the way candles show buying and selling pressure.
Remember: you are reading a description of one finished period, not a forecast.
Big bodies
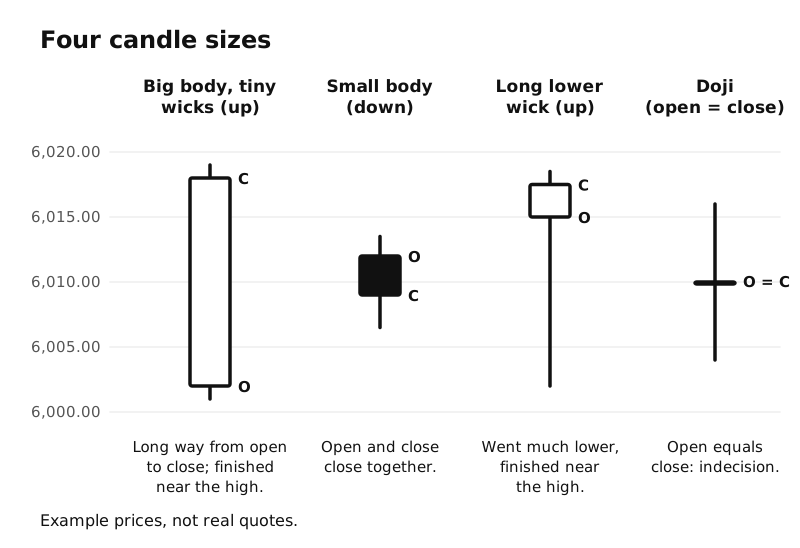
A big body (long from open to close) means price traveled a long way from where the period started to where it finished. CME’s course reads a longer body as more intense buying or selling during that period.
- A big hollow body (close above open): buyers moved price up a long way and it stayed up into the close.
- A big filled body (close below open): sellers moved price down a long way and it stayed down into the close.
If a big body has little or no wick, price spent the period moving in one direction and finished near its extreme. CME describes that as one side being in control for the whole period.
Small bodies
A small body means the open and close were close together. However much price moved during the period, it finished near where it began. CME’s course describes this as a period without much strength in the price action.
Long wicks
A long wick means price reached a long way in one direction during the period but did not hold there. It was pushed back before the close.
- A long upper wick: price went up a lot, then came back down before the close.
- A long lower wick: price went down a lot, then came back up before the close.
When wicks are long, the range was wide but the body was not, which CME’s course describes as both buyers and sellers being active in that period.
Where the small body sits also tells you how the period ended. A small body near the top of a long candle means price finished near the high after trading much lower. A small body near the bottom means price finished near the low after trading much higher. CME reads those as one side taking control late in the period.
(You may also hear wicks called shadows or tails. Same thing. Schwab’s education articles use “wick or shadow” and “wicks or tails”.)
The doji: open and close almost equal
When the open and close are equal, or nearly equal, the body shrinks to a thin line. Traders call this candle a doji. TradingView’s help page describes a doji as a candle whose open and close are essentially equal, with the close at or near the opening level. It can have short wicks or long ones, but the key feature is the missing body: price went somewhere during the period and then ended up right back where it started.
That is why a doji is often described as indecision; TradingView’s doji page calls it a tug-of-war between buyers and sellers. Neither buyers nor sellers finished the period ahead. Lesson 6 shows a few named doji shapes as vocabulary.
Size is relative
“Big” and “small” only mean something compared with nearby candles on the same chart. A 10-point body might be huge on a 1-minute chart and ordinary on a daily chart. Always compare a candle with its neighbors, not with a fixed number.
Not a signal
A big body, a long wick, or a doji tells you what happened during one period. None of them tells you what the next candle will do, and none of them is a reason to buy or sell on its own.
Key ideas
- A big body means price moved a long way from open to close; with tiny wicks, it finished near its extreme.
- A small body means the period finished near where it started.
- A long wick shows price reached far but was pushed back before the close.
- A doji has open and close equal or nearly equal: a picture of indecision.
- Size is relative to nearby candles, and no size is a signal by itself.